There is a question every engineer knows how to answer about a slow database query: why was it slow?
That wasn't always straightforward. Take for example Datadog, which had basic database monitoring for years, but it was Deep Database Monitoring, launched in August 2021, that changed things. I was lucky enough to get early access before the general release, and it was a turning point for the developers I worked with. The information had always existed, in the database, in the query plans, in the infrastructure metrics, but you had to pull it from multiple places and connect the dots manually. Deep Database Monitoring assembled it in one place, correlated with APM traces. Engineers could finally understand whether a performance issue was at the database or infrastructure level without leaving the dashboard. It gave them the visibility to make better architectural decisions instead of guessing.
LLM observability is at that same early stage right now. I wanted to find out exactly where it stands and what the gap is.
Same code, four runs, two products
I ran the same code review task four times.
Two providers: Anthropic and OpenAI.
Two observability tools: Datadog as the primary test vehicle, both its standard APM product and its purpose-built LLM Observability product.
One validation run in Honeycomb to test whether the gaps were Datadog-specific or structural.
Three call sites each time: single-turn completion, streaming response, and structured JSON output.
The question I was trying to answer was simple. What does each product actually show you about an LLM call? And is there a gap between what you can see and what you'd need to know to operate an LLM dependency the way you'd operate a database or a third-party API?
What any observability tool gives you by default
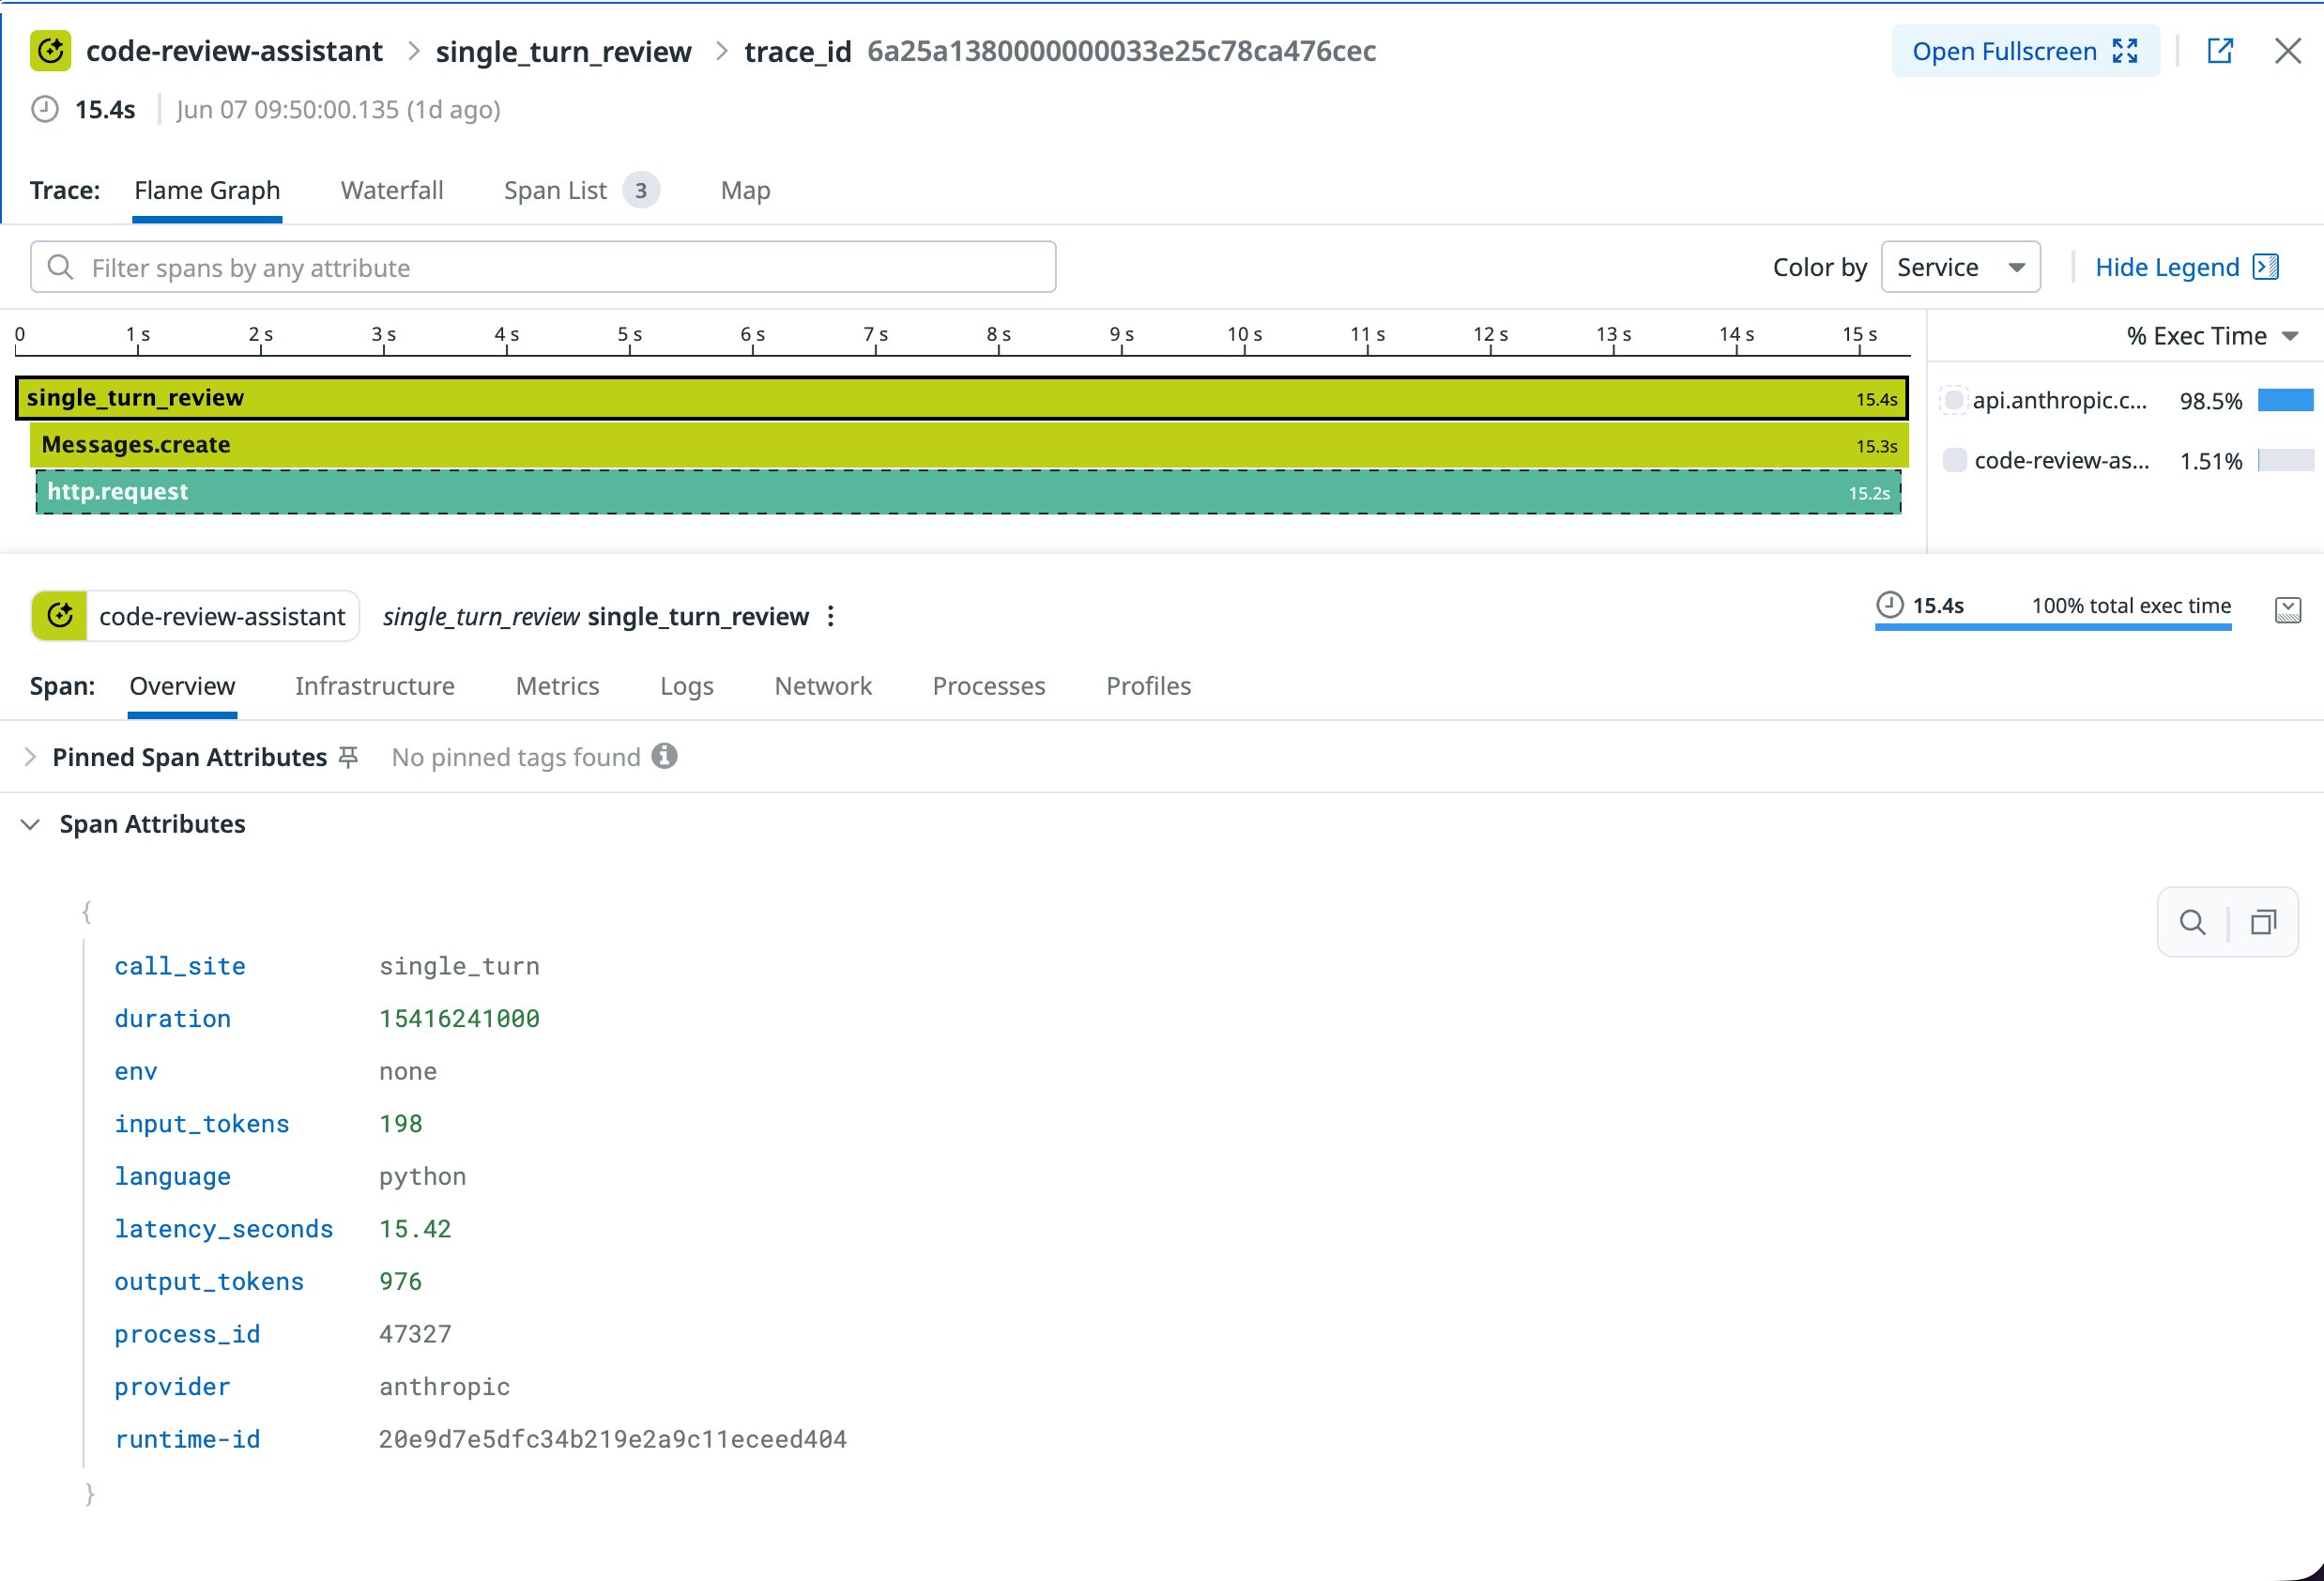
Standard APM gave me what I'd expect from any HTTP dependency. The request succeeded. It took 15.4 seconds. 198 input tokens, 976 output tokens. The trace showed three nested spans: single_turn_review, Messages.create, and http.request. The exec time breakdown showed 98.5% on Anthropic's API, 1.51% on the application code. The additional attributes in the trace, call_site, provider, latency_seconds, were added explicitly by the instrumentation script. Without that work, they wouldn't appear.
That's it.
The 15.4 seconds was the most interesting number, and also the most frustrating one. With a database query, a 15-second trace is a starting point. You drill into it. You find the slow part. You act.
With an LLM call, 15.4 seconds is the whole story. The trace stops at the model boundary. There is no query execution plan for an LLM call. You know when the request started and when it ended. On the other side of that boundary, the model is managing memory, queuing requests, and processing tokens in batches. Any of those could explain why it took 15 seconds. But none of it surfaces in the trace. You're reading about it here, not seeing it there.
The streaming call made this gap more visible, not less. The HTTP span opened fast. time_to_first_token was 1.06 seconds, a custom tag added by the instrumentation script. Then the streaming connection sat open for another 14 seconds while the rest of the tokens arrived. APM recorded the total duration but had no concept of that breakdown.
Where purpose-built tooling goes further
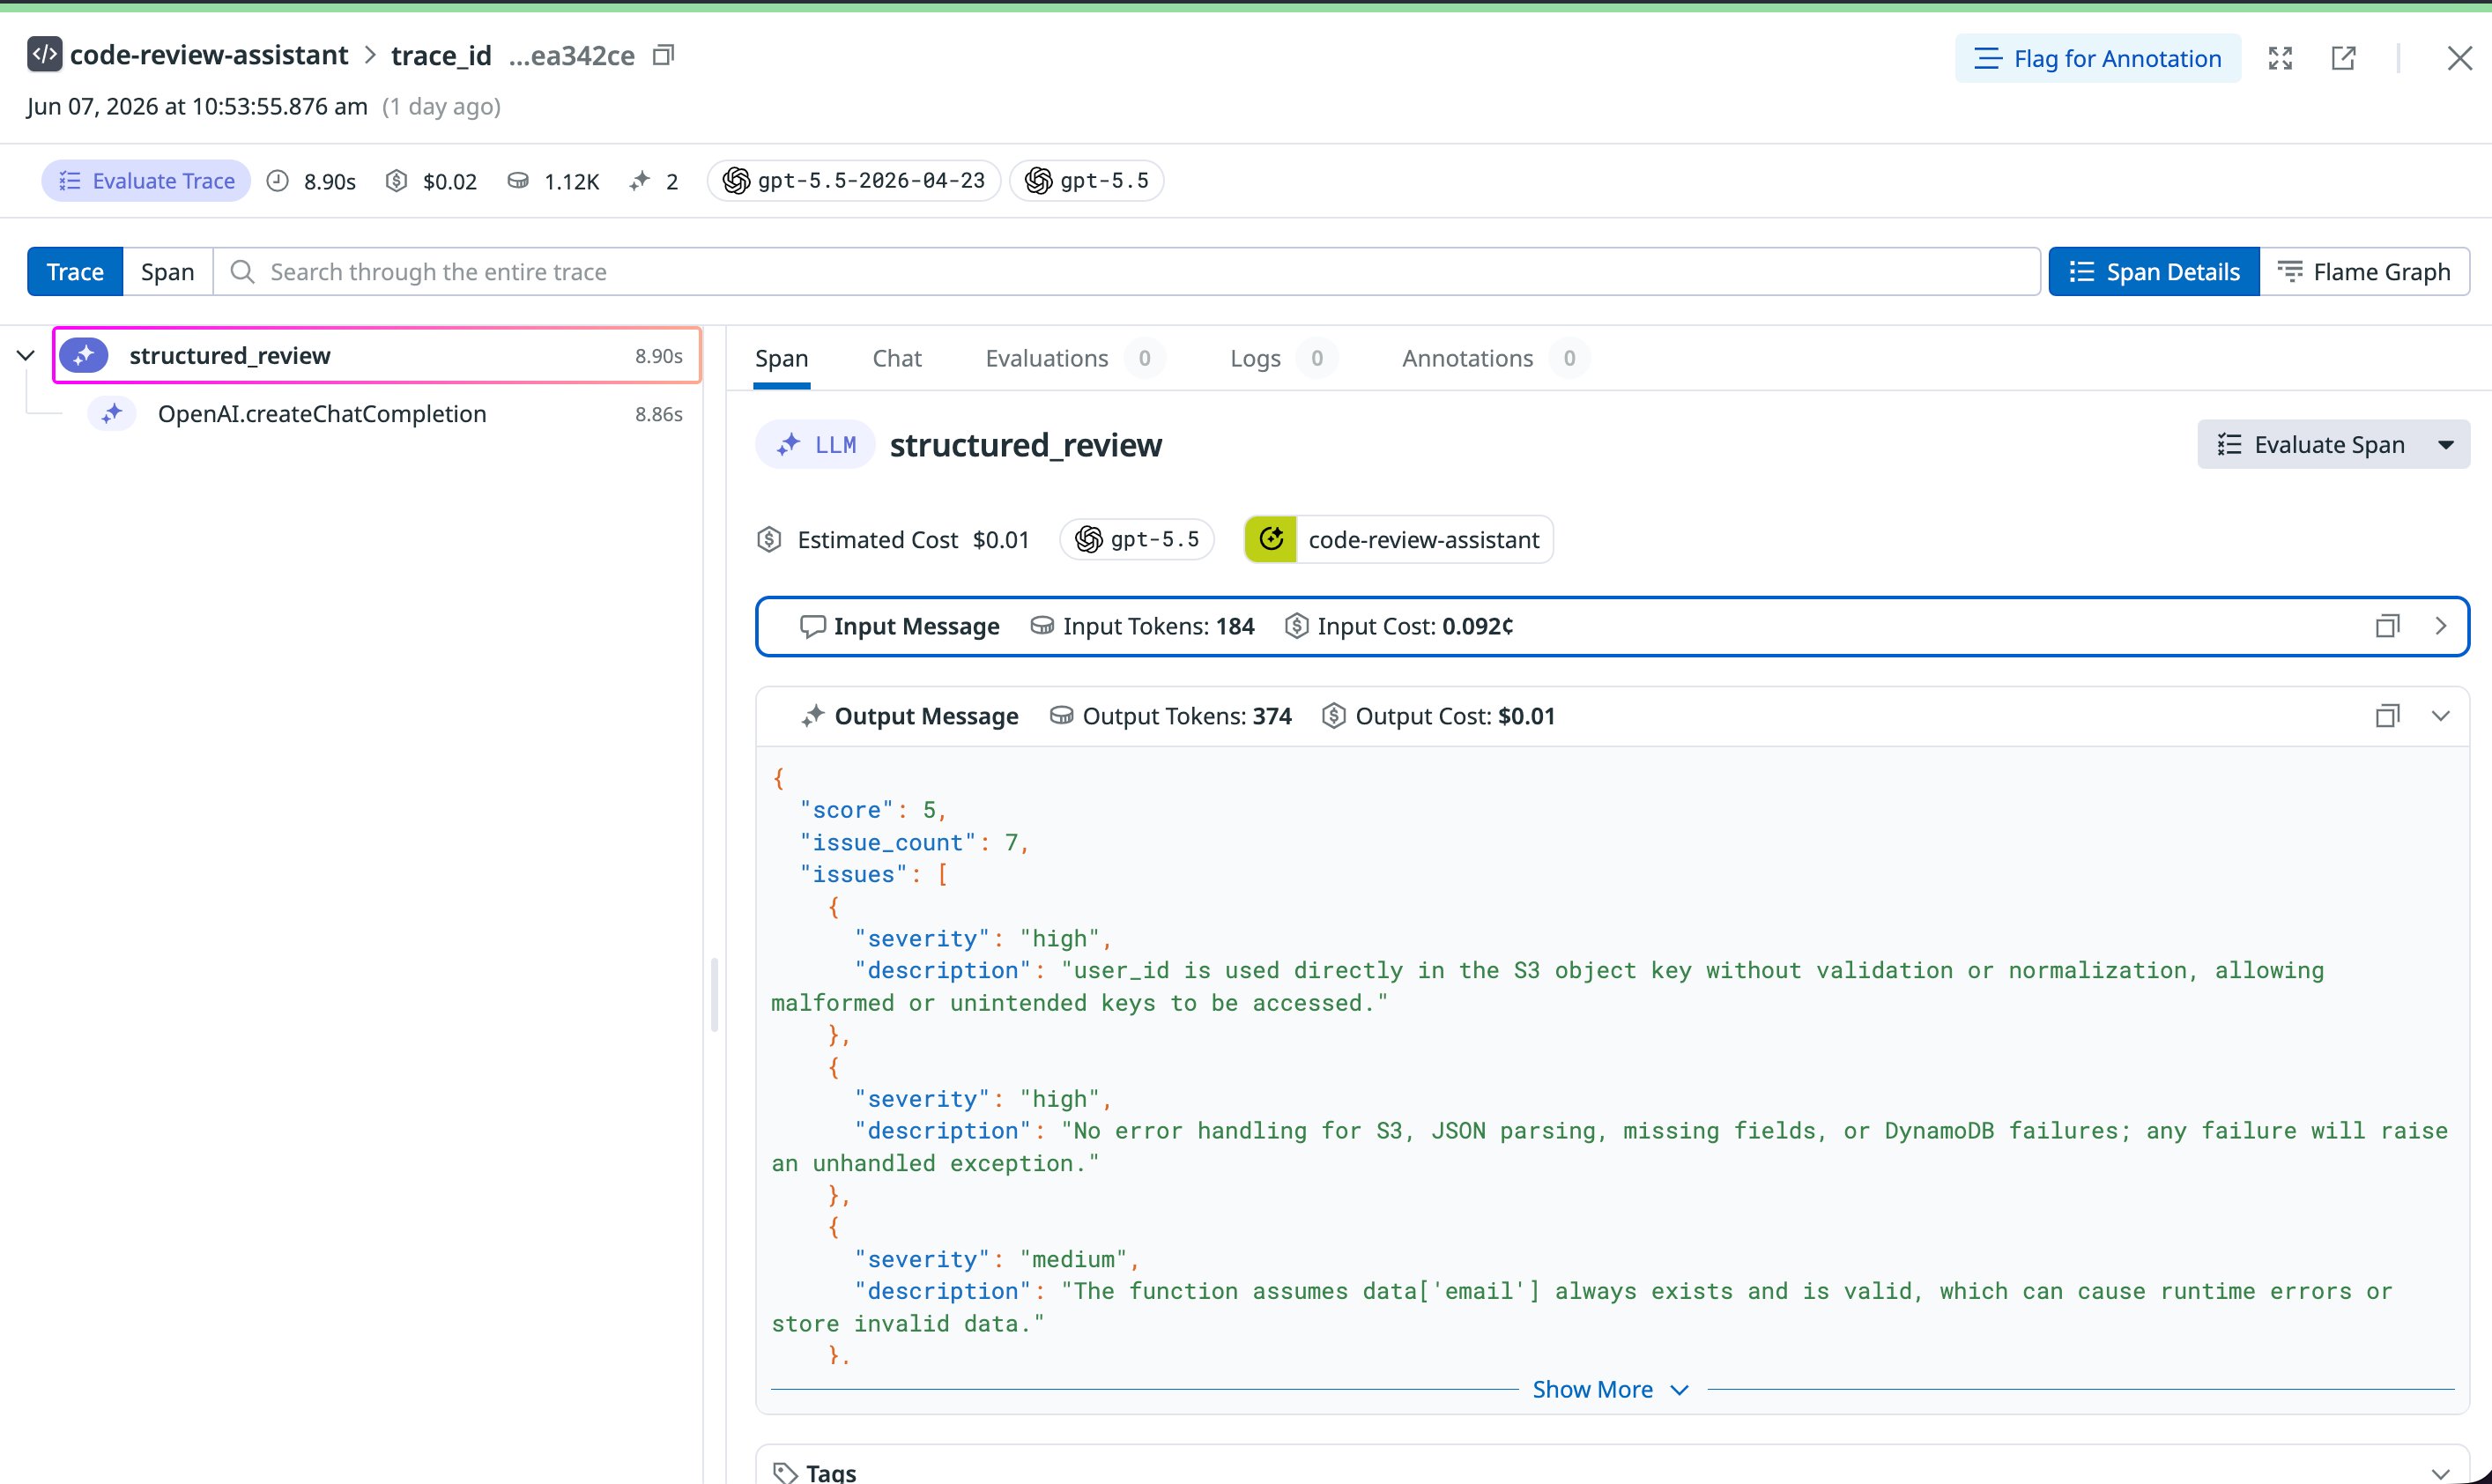
The LLM-specific product gave me something standard APM didn't: the actual content. I could see the full prompt, the full output, the estimated cost ($0.02 per call), a token breakdown by input and output. For the structured JSON call, I could see whether the output parsed correctly.
That matters. If you're debugging a bad output, seeing the prompt and response in the trace is genuinely useful. If you're tracking costs, having estimated cost per call in the trace is useful.
One detail worth noting: the LLM-specific product surfaces the specific model snapshot, not just the alias. The trace showed gpt-5.5-2026-04-23 alongside gpt-5.5. The alias stays the same. The snapshot tells you which version actually ran.
But the latency question remained unanswered: why was this call slow? The LLM-specific product, run separately from the APM run, showed 15.9 seconds. Close to the 15.4 seconds APM recorded, but a different run with its own latency. It added context around the call. It didn't add visibility into the call itself.
The LLM-as-a-judge approach
Some purpose-built LLM observability products go beyond showing you what the model said. They run another model to score it for you. Datadog LLM Observability includes this as a configurable evaluation layer. After my first run, the evaluations tab showed: Hallucination: True. Verbosity: 0.86. User Negativity: False. Correct Tool Selection: True.
It's a real attempt to close this gap. But it opens a different one.
The "Hallucination: True" flag on my single-turn code review. Was that correct? The model was analyzing Python code for security issues, not generating factual claims about the world. Whether the hallucination detector's judgment was accurate is unknowable from the trace. You now have an AI evaluating an AI, and the evaluation itself is opaque. The gap doesn't close. It moves.
What neither product surfaced
Running the same code four times produced a finding that only became clear when I ran a second observability tool. The Anthropic single-turn run scored 4/10 in APM and 3/10 in LLMObs. Neither trace showed anything had changed between runs. Same duration, same token counts, same status. It wasn't until Honeycomb surfaced finish_reasons that the explanation emerged: the APM run hit the token limit and was truncated. The score of 4/10 came from an incomplete response. The score of 3/10 came from a complete one.
Neither Datadog product showed this. From either trace alone, you would conclude both runs produced equivalent output. The difference was invisible without a second tool.
OpenAI tells the cleaner story on consistency. It scored the same code 5/10 in both modes, found 7 issues each time, and returned finish_reason: ['stop'] in every run. That's what consistent LLM behavior looks like in a trace. Even then, the trace tells you nothing about whether those 7 issues were the right 7 issues.
A known problem, a harder version
LLM calls share a characteristic with every third-party API: you send a request, something happens on the other side, you get a response. The industry has developed partial answers to this: SLAs and status pages for contractual visibility, synthetic monitoring to detect degradation from outside, circuit breakers to route around slow dependencies. Those tools work because the API behavior is consistent and predictable. The same request, in the same context, produces the same response. You can measure that consistency over time and alert when it breaks.
LLMs break that assumption. The same request does not reliably produce the same response. That's not a provider reliability problem. It's how the technology works. You can monitor whether a payment API is slow. You can't monitor whether an LLM gave a different answer than it did yesterday.
What a third tool showed
The latency question and the output quality question both hit the same wall: the trace stops at the model boundary. This problem isn't unique to Datadog. It's a category problem. Every observability tool in this space faces the same boundary: the model is a black box, and no trace can follow a request inside it.
To verify that, I ran the same call through Honeycomb using OpenLLMetry. The structural gap was identical. But Honeycomb surfaced something neither Datadog product showed: finish_reasons. The Anthropic single-turn run returned ['length'], meaning it was truncated at the token limit. The score of 4/10 came from an incomplete response. OpenAI returned ['stop'] on both runs, meaning it completed normally.
That distinction was invisible in both Datadog products. finish_reasons could be added as a custom span tag, but only if you already knew to look for it. Honeycomb captured it automatically because it was built specifically for LLM calls. You don't know what you're not seeing until another tool shows it to you.
The span structure differed too. Datadog APM instrumented three layers: the outer function, the SDK call, and the HTTP request underneath it. Datadog LLM Observability and Honeycomb both show two spans, collapsing the SDK and HTTP into a single LLM-aware span. The difference matters: APM's three-span view gives you the exec time breakdown, showing where in your stack the time was spent. The two-span view gives you richer LLM-specific attributes in one place. You wouldn't know which trade-off you were making until you looked at both.
Closing the gap requires things that don't exist yet
Closing this gap would require two things that don't exist yet. The first is provider-side visibility into what the model was doing during the wait. That's unlikely to happen at the API layer. The second is a way to compare output quality across runs. Not whether the request succeeded. Whether the answer changed.
That's not a criticism of any one observability product. This experiment was about understanding where the category stands right now. The field itself is young. Purpose-built LLM observability only emerged as a category around 2023.
The trace can tell you that a request completed. It cannot tell you whether the answer was consistent. What happens inside the model, whether it happens the same way twice, and whether the response even completed, remains outside the reach of any single observability stack.
What you can do today
The gap is real. But it isn't a reason to stop. There are things you can do today.
- Log the full response alongside your traces in your own store. Compare outputs across runs for the same prompt. If they differ, your trace won't tell you why, but at least you'll know they differed.
- Know which attributes your tool captures automatically and which require explicit instrumentation.
finish_reasonsis a good test case: Honeycomb captured it automatically, Datadog required a custom span tag. What else are you missing without knowing it? - Evaluate more than one observability tool. The gaps in one product only become visible when you look through a second one.
The deeper question is what else is invisible, and whether you can build something to govern it. That's the next experiment.
Methodology Setup, run commands, and root causes
Four runs, all on the same day:
- Anthropic: APM mode
- Anthropic: LLM Observability mode
- OpenAI: APM mode
- OpenAI: LLM Observability mode
Models: claude-sonnet-4-6 (Anthropic), gpt-5.5-2026-04-23 (OpenAI). Instrumentation: Datadog ddtrace 4.10.2, Python 3.11.
Three root causes found during setup worth noting for anyone replicating this:
DD_APM_TRACING_ENABLED=false: without this, ddtrace routes LLMObs data through the APM trace writer and AI Observability never receives it.SSL_CERT_FILEpointing to certifi's CA bundle: macOS Python cannot verify the LLM intake endpoint's certificate without this.- Explicit
ml_app=on each span: the global environment variable sets config but LLMObs spans need it passed directly at span creation.
Custom span tags added by the instrumentation script:
The APM traces show more than Datadog captures automatically. Several attributes were added explicitly: call_site, provider, latency_seconds, time_to_first_token (streaming only), output.score, output.issue_count, and parse_success. Without these custom tags, an out-of-the-box APM trace of the same calls would show total duration, HTTP status, service name, and the nested span structure. Nothing else. Teams instrumenting production LLM calls without this additional work would see considerably less than what appears in the screenshots above.
Span structure differs by instrumentation library: ddtrace creates three spans per call (outer function, SDK call, HTTP request), while OpenLLMetry creates two (outer function, LLM-aware API span). Datadog's three-span structure gives you an exec time breakdown showing where time was spent across layers. OpenLLMetry abstracts the HTTP layer into a single LLM-semantic span with richer GenAI attributes. Neither is objectively better. They reflect different design priorities.
APM run command:
SSL_CERT_FILE=$(python3 -c "import certifi; print(certifi.where())") \
DD_API_KEY="your_key" \
DD_SITE="us5.datadoghq.com" \
DD_SERVICE="code-review-assistant" \
DD_TRACE_AGENTLESS=false \
DD_LLMOBS_ENABLED=0 \
DD_LLMOBS_AGENTLESS_ENABLED=0 \
ddtrace-run python3 instrumented_review.py --provider anthropic --mode apm
LLM Observability run command:
SSL_CERT_FILE=$(python3 -c "import certifi; print(certifi.where())") \
DD_APM_TRACING_ENABLED=false \
DD_API_KEY="your_key" \
DD_SITE="us5.datadoghq.com" \
DD_LLMOBS_ENABLED=1 \
DD_LLMOBS_ML_APP="code-review-assistant" \
DD_LLMOBS_AGENTLESS_ENABLED=1 \
DD_SERVICE="code-review-assistant" \
ddtrace-run python3 instrumented_review.py --provider anthropic --mode llmobs
Results Output comparison across all four runs
All four runs used the same Python function as the review target, a process_user_data function with several intentional security and quality issues.
| Provider | Mode | Score | Issues found |
|---|---|---|---|
| Anthropic | APM | 4/10 | 7 |
| Anthropic | LLMObs | 3/10 | 8 |
| OpenAI | APM | 5/10 | 7 |
| OpenAI | LLMObs | 5/10 | 7 |
Gap log What APM and LLM Observability showed across all runs
Visibility comparison across all four runs:
| Question | APM | LLM Observability |
|---|---|---|
| Request basics | ||
| Did the request succeed? | Yes | Yes |
| How long did it take? | Yes | Yes |
| How many tokens were used? | Yes | Yes |
| Latency | ||
| Why was this request slow? | No | No |
| Time to first token (streaming)? | Via custom tag only | No |
| Where did latency accumulate? | No | No |
| Output quality | ||
| What did the model actually say? | No | Yes |
| What did it cost? | No | Yes |
| Did the response complete or was it truncated? | No | No |
| Did the output degrade vs last run? | No | No |
| Did the model's verdict change? | No | No |
| Did severity ratings shift between runs? | No | No |
| Routing and judgment | ||
| Would a different model have said something different? | No | No |
| Was the routing decision correct? | No | No |
| Did the JSON parse correctly? | No | Yes |
What APM consistently showed: Request success, total latency, token counts.
What LLM Observability added over APM: Full prompt and response content, estimated cost per call, token cost breakdown, JSON parse visibility.
What neither product could show: Why a request was slow, whether latency was normal or degraded, whether output quality changed between runs, whether the routing decision was correct.
Did the gap differ between Anthropic and OpenAI? No. The same blind spots existed for both providers.
The question most wanted to answer that couldn't be: What was actually happening during the 15-second wait? Once the model responded, tokens arrived in milliseconds. The latency was entirely in the pre-response period, opaque to both products.